
Lowest economy in ODI
· Data: Cricsheet (ODC-By) and CRIX scorecards
The top 50 players on file, all-time. Pick a year to see one season.
Top 27
| Player | Econ | M | Inn | Ave | SR |
|---|---|---|---|---|---|
1BS Bernard ScholtzNamibiaM 25 · Inn 24 · Ave 15.56 · SR 27.96 | 3.34 | 25 | 24 | 15.56 | 27.96 |
2WZ Wahidullah ZadranAfghanistan U19M 21 · Inn 21 · Ave 21.03 · SR 35.03 | 3.60 | 21 | 21 | 21.03 | 35.03 |
3SN Saurabh NetravalkarUnited StatesM 23 · Inn 23 · Ave 23.91 · SR 35.76 | 4.01 | 23 | 23 | 23.91 | 35.76 |
4MM Mehidy Hasan MirazBangladesh, Legends of Rupganj, Bangladesh U19M 36 · Inn 36 · Ave 30.19 · SR 44.21 | 4.10 | 36 | 36 | 30.19 | 44.21 |
5MS Mitchell SantnerNew Zealand, Northern BraveM 24 · Inn 24 · Ave 25.71 · SR 36.85 | 4.19 | 24 | 24 | 25.71 | 36.85 |
6JS JJ SmitNamibia, Namibia U19M 35 · Inn 35 · Ave 23.62 · SR 33.68 | 4.21 | 35 | 35 | 23.62 | 33.68 |
7SZ Saad Bin ZafarCanadaM 22 · Inn 22 · Ave 38.70 · SR 55.15 | 4.21 | 22 | 22 | 38.70 | 55.15 |
8SL Sandeep LamichhaneNepal, Nepal U19M 24 · Inn 24 · Ave 22.90 · SR 31.31 | 4.39 | 24 | 24 | 22.90 | 31.31 |
9SR Samiun Basir RatulLegends of Rupganj, Bangladesh Emerging, Bangladesh U19M 34 · Inn 33 · Ave 22.51 · SR 30.68 | 4.40 | 34 | 33 | 22.51 | 30.68 |
10MW Mark WattScotland, Scotland U19M 27 · Inn 27 · Ave 37.63 · SR 51.22 | 4.41 | 27 | 27 | 37.63 | 51.22 |
11JL Jayden LennoxNew Zealand, Central Stags, New Zealand AM 27 · Inn 27 · Ave 25.76 · SR 34.67 | 4.46 | 27 | 27 | 25.76 | 34.67 |
12TI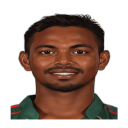 Tanvir IslamBangladesh, Mohammedan Club, Bangladesh AM 22 · Inn 22 · Ave 28.16 · SR 37.88 | 4.46 | 22 | 22 | 28.16 | 37.88 |
13KC Kanishk ChouhanIndia U19M 25 · Inn 25 · Ave 27.47 · SR 36.80 | 4.48 | 25 | 25 | 27.47 | 36.80 |
14MR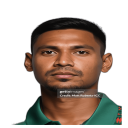 Mustafizur RahmanBangladesh, Abahani, Bangladesh U19M 23 · Inn 24 · Ave 23.71 · SR 31.14 | 4.57 | 23 | 24 | 23.71 | 31.14 |
15MB Michael BracewellNew ZealandM 26 · Inn 22 · Ave 32.62 · SR 41.69 | 4.69 | 26 | 22 | 32.62 | 41.69 |
16KY Kuldeep YadavIndia, India A, India U19, YorkshireM 28 · Inn 28 · Ave 26.35 · SR 32.39 | 4.88 | 28 | 28 | 26.35 | 32.39 |
| 17ANAndrew NealHampshireM 19 · Inn 19 · Ave 46.72 · SR 57.28 | 4.89 | 19 | 19 | 46.72 | 57.28 |
18BM Brandon McMullenScotland, HampshireM 28 · Inn 26 · Ave 26.63 · SR 32.57 | 4.91 | 28 | 26 | 26.63 | 32.57 |
19RT Ruben TrumpelmannNamibiaM 28 · Inn 26 · Ave 28.37 · SR 34.63 | 4.91 | 28 | 26 | 28.37 | 34.63 |
20GM Gudakesh MotieWest Indies, Guyana Harpy Eagles, West Indies U19M 22 · Inn 21 · Ave 40.22 · SR 48.17 | 5.01 | 22 | 21 | 40.22 | 48.17 |
21JS Junaid SiddiqueFujairah, United Arab EmiratesM 25 · Inn 25 · Ave 24.64 · SR 29.45 | 5.02 | 25 | 25 | 24.64 | 29.45 |
22MF MD Al FahadDhaka Leopards, Bangladesh U19M 25 · Inn 25 · Ave 20.86 · SR 24.50 | 5.11 | 25 | 25 | 20.86 | 24.50 |
23JB Jacob BassonSouth Africa Emerging, South Africa U19M 22 · Inn 22 · Ave 27.06 · SR 31.59 | 5.14 | 22 | 22 | 27.06 | 31.59 |
24BM Buyanda MajolaDolphins, South Africa U19M 22 · Inn 22 · Ave 26.44 · SR 30.85 | 5.14 | 22 | 22 | 26.44 | 30.85 |
25NS Nathan SmithNew Zealand, New Zealand U19, WellingtonM 28 · Inn 28 · Ave 35.13 · SR 37.35 | 5.64 | 28 | 28 | 35.13 | 37.35 |
26AR Adil RashidEnglandM 21 · Inn 21 · Ave 25.79 · SR 26.68 | 5.80 | 21 | 21 | 25.79 | 26.68 |
27JM James MintoEngland U19, DurhamM 27 · Inn 27 · Ave 28.45 · SR 28.32 | 6.03 | 27 | 27 | 28.45 | 28.32 |
Ranked among players who have bowled at least 1000 balls.